-
Graphing Food and Nutrition
Isabel Thomas
Paperback (Heinemann, )None O
O
-
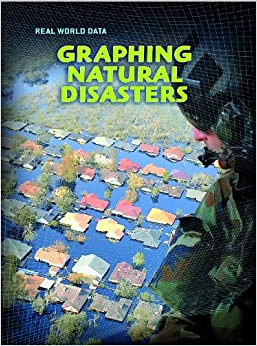
Graphing Natural Disasters
Barbara Somervill, Megan Cotugno
Library Binding (Heinemann, Jan. 1, 2010)Which volcanic eruption caused the "year without a summer"? What is a seismograph? How are tornadoes measured? Real World Data presents information about familiar curricular topics through charts and graphs. Each title shows how to organize data in different visual forms, and how to interpret and create tables, line graphs, bar graphs, and pie charts. Y
Y
-
Graphing Natural Disasters
Barbara A. Somervill, Geoff Ward
Hardcover (Heinemann Library, )None
-
Graphing Money
Patrick Catel, Megan Cotugno
Library Binding (Heinemann, Jan. 1, 2010)What is mercantilism? How does the free-enterprise system work? What happens when a country spends more than it takes in during a year? Real World Data presents information about familiar curricular topics through charts and graphs. Each title shows how to organize data in different visual forms, and how to interpret and create tables, line graphs, bar graphs, and pie charts. V
V
-
Graphing Global Politics
Marta Segal Block, Megan Cotugno
Library Binding (Heinemann, Jan. 1, 2010)What is the Security Council? Which international organizational helps people around the world earn a decent living? How does a direct democracy differ from a representational democracy? Real World Data presents information about familiar curricular topics through charts and graphs. Each title shows how to organize data in different visual forms, and how to interpret and create tables, line graphs, bar graphs, and pie charts. S
S
-
Graphing Planet Earth
Elizabeth Miles, Andrew Solway, Sarah Medina, Isabel Thomas, Deborah Underwood
Paperback (Heinemann Library, Sept. 26, 2008)Graphing Planet Earth N
N
-
Graphing the Environment
Andrew Solway
Paperback (Heinemann, Dec. 4, 2008)What is acid rain? Why is so much farmland now damaged? How can ecotourism help the environment? The 'Real World Data' series presents information about familiar curricular topics through charts and graphs. Each title shows how to organize data in different visual forms, and how to interpret and create tables, line graphs, bar graphs, and pie charts. T
T
-
Graphing Habitats
Sarah Medina
Paperback (Heinemann, Oct. 2, 2008)How do camels survive in the desert? What are “alien” species? Why do humans often destroy habitats? Real World Data presents information about familiar curricular topics through charts and graphs. Each title shows how to organize data in different visual forms, and how to interpret and create tables, line graphs, bar graphs, and pie charts. S
S
-
Graphing Planet Earth
Elizabeth Miles
Paperback (Heinemann, Oct. 2, 2008)What was the Big Bang? How are volcanoes formed? Where are the “lands of the midnight sun”? Real World Data presents information about familiar curricular topics through charts and graphs. Each title shows how to organize data in different visual forms, and how to interpret and create tables, line graphs, bar graphs, and pie charts. U
U
-
Graphing Transportation
Deborah Underwood
Paperback (Heinemann, Dec. 4, 2008)What is a flex fuel car? How long is the world’s largest air plane? Where is the Iditarod race held? The 'Real World Data' series presents information about familiar curricular topics through charts and graphs. Each title shows how to organize data in different visual forms, and how to interpret and create tables, line graphs, bar graphs, and pie charts. Y
Y
-
Graphing Water
Sarah Medina
Paperback (Heinemann, Oct. 2, 2008)How much of the human body is made up of water? Which regions experience the monsoon? What percentage of the world’s water is freshwater? Real World Data presents information about familiar curricular topics through charts and graphs. Each title shows how to organize data in different visual forms, and how to interpret and create tables, line graphs, bar graphs, and pie charts. U
U
-
Graphing Buildings and Structures
Yvonne Thorpe
Paperback (Heinemann, Dec. 4, 2008)What is a suspension bridge? How long is the Channel Tunnel? Where is the world’s tallest building? The 'Real World Data' series presents information about familiar curricular topics through charts and graphs. Each title shows how to organize data in different visual forms, and how to interpret and create tables, line graphs, bar graphs, and pie charts. S
S